
How AI Analyzes Real-Time Feedback for ROI

AI pays off when it helps you cut support cost, save at-risk accounts, and solve issues faster. In this piece, I’d boil the whole idea down to four numbers: deflection rate, cost per conversation, response time, and retention.
Here’s the short version:
- I’d track live feedback, not monthly reports, because delays can cost you renewals and add support spend.
- I’d connect each signal to a business result. For example, repeat contacts point to more cost, while negative sentiment can point to churn risk.
- I’d put chat, SMS, and WhatsApp data into one place with clear fields like customer ID, timestamp, handoff, and outcome.
- I’d use AI to score sentiment, intent, topics, and escalation risk so teams can step in during the conversation.
- I’d measure ROI in dollars with a simple formula: gains and savings minus AI cost, divided by AI cost.
A few numbers stand out:
- A U.S. support ticket can cost about $32.50
- Many teams review only 1% to 30% of interactions
- Some conversational AI projects break even in about 3.4 months
- In 2026, 61% of CEOs said they felt more pressure to prove AI returns
What I like about this approach is that it keeps the focus on outcomes, not activity. More feedback data alone doesn’t help. Using it fast enough to change routing, resolution, or retention does.
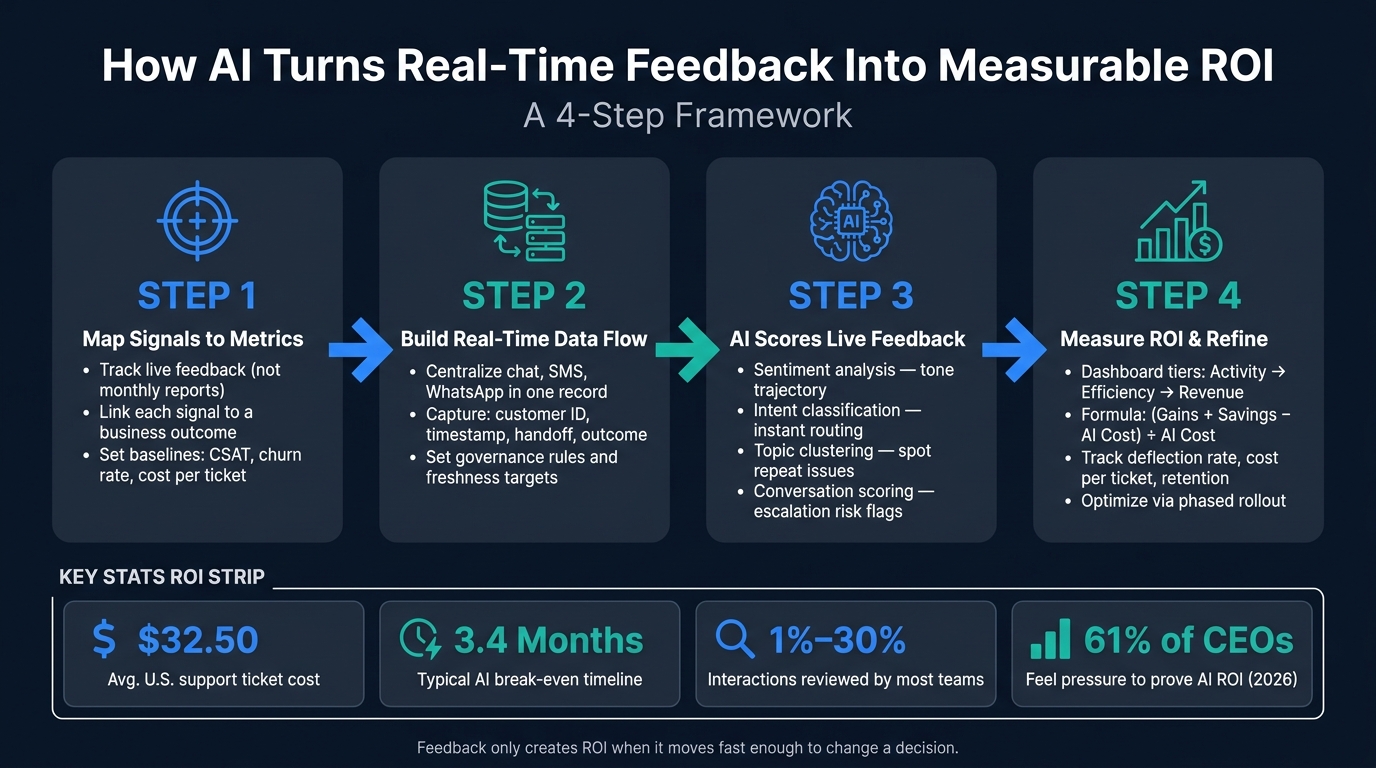
How AI Turns Real-Time Feedback Into Measurable ROI: A 4-Step Framework
Step 1: Map Feedback Signals to Business Metrics
Identify the feedback sources worth tracking
Track the channels that have a direct effect on revenue or cost. Start with the feedback sources most closely linked to retention and support spend: onboarding, renewal-risk, and cancellation or refund conversations [6][1]. In most cases, that means looking at support tickets, live chat, WhatsApp, and SMS threads first [6][1].
Once you know which channels matter most, connect each signal to the business result it can influence.
Connect each feedback signal to an ROI outcome
Only track signals that connect to money in or money out. A negative tone in a chat transcript can point to churn risk. Repeat contacts often mean weak resolution quality and higher support cost. “How do I...” onboarding questions usually point to friction that slows completion and cuts into LTV.
Here’s a simple way to connect each signal to an operating metric, then to a dollar outcome:
| Feedback Signal | Operational Metric | ROI Metric | Typical Data Source |
|---|---|---|---|
| CSAT < 3/5 or negative sentiment | Churn Rate | Retention Value ($) | Post-resolution surveys, chat transcripts [4][8] |
| Repeat contacts | First Contact Resolution (FCR) | Support cost savings | Helpdesk logs, WhatsApp/SMS history [4] |
| Feature requests / unmet needs | Upsell conversion rate | Expansion revenue | Conversation transcripts, sentiment analysis [6][8] |
| High volume of FAQ queries | True Deflection Rate | Headcount avoidance | Web chat, AI bot logs [4][7] |
| Response-time complaints | Average speed to lead / FRT | Conversion revenue | SMS, live chat timestamps [7] |
| "How do I..." signals | Onboarding completion rate | Customer lifetime value (LTV) | Onboarding chat / WhatsApp |
After that map is in place, set baselines. If you skip this step, AI has nothing clear to aim at.
Set clear targets before using AI
Write down your current numbers before AI analysis begins. This is a big deal because 62% of Voice of Customer leaders can't produce a financial ROI figure for their programs when they measure activity instead of outcomes [8]. No baseline means no clean way to prove what changed.
Set targets that are specific and easy to measure. For example:
- Increase CSAT from 4.2 to 4.5
- Reduce monthly churn by 1.0%
- Lower support costs by $8,000 per month
This table shows a practical starting point:
| Metric Category | Baseline Example | Year-1 Target |
|---|---|---|
| Customer satisfaction | 4.2 CSAT score | 4.5 CSAT score [4] |
| Retention | 15% annual churn | 14% annual churn (1.0% reduction) [8] |
| Support efficiency | $32.50 cost per ticket | $26.00 cost per ticket (20% reduction) [4] |
| Response speed | 8-hour average response | 5-minute AI response [5] |
With signals mapped and targets set, the next step is building a clean, real-time data flow.
sbb-itb-e1b05dc
Step 2: Build the Data Flow for Real-Time Analysis
Centralize conversations and feedback in one place
Once your baselines are set, the next issue is simple: feedback lives in too many places.
After you define the metrics, you need a pipeline that can track them in real time. That means every conversation needs to land in one record, no matter which channel it came from. If that doesn’t happen, AI can’t link feedback to churn, cost, or resolution speed in a dependable way.
A shared inbox helps bring together web chat, WhatsApp, and SMS so both AI and human agents keep the full context. If a customer starts on web chat and later follows up on WhatsApp, the same thread stays connected. That setup matters because it keeps the history intact instead of splitting it across systems.
Still, that only works if every event is captured in the same format.
Capture clean, time-stamped, usable data
Pulling channels into one place is only part of the work. The data also needs enough structure for AI to use it well.
Each record should include five fields:
- customer ID
- channel
- timestamp
- handoff point
- outcome label, such as resolved, escalated, or abandoned
With those fields in place, AI can trace patterns across channels, agents, and outcomes.
Without them, the signal gets blurred. Instead of getting specific, usable insights, you end up with averages that hide what’s going on. Consistent identifiers like tenant, product area, channel, severity, and language keep the analysis precise [9].
Clean data alone isn’t enough, though. You also need clear rules around access, ownership, and freshness.
Add governance before scaling analysis
Before you scale this setup, put guardrails in place.
Restrict inbox access by team, product, or segment. Converso supports multiple workspaces and inboxes, which lets you separate data by department, product line, or customer segment without mixing signals.
It also helps to set a freshness target. For example, you might aim to have 95% of critical feedback classified within 4 hours. That kind of rule keeps reporting steady enough to compare teams and time periods without guesswork.
Ownership matters too. Spell out who handles each layer:
- who monitors data ingestion
- who reviews AI classifications
- who acts on the output
When those rules are clear, the insights are steady enough to use in live support. Then AI can move from just reading feedback to scoring it and triggering action.
Step 3: Use AI to Act on Live Feedback
Analyze sentiment, intent, and recurring topics
Once the data is clean, AI can turn each signal into action.
Sentiment analysis tracks tone across a conversation. What matters most isn't one score in isolation. It's the direction of the conversation over time. A drop across three back-to-back turns points to escalation risk [2].
Intent classification labels what the customer is trying to do, so routing can happen right away instead of after a manual review. With domain-aware training, AI can tell the difference between a feature request and a bug report [14].
Topic clustering helps teams spot repeat problems at scale. Instead of reading complaints one by one, AI groups hundreds of conversations into themes like onboarding friction, pricing resistance, or a specific product bug, without pre-defined labels [6]. That gives support teams a way to catch system-level issues before they start showing up in churn data.
Score conversations for quality and escalation risk
Not every conversation needs a human. Some do. And if you catch those too late, the cost adds up fast.
AI can score conversations by combining sentiment trajectory, intent confidence, and behavioral signals. Say the intent classifier is landing at only 60% to 70% confidence for a certain query type. That's a coverage gap worth flagging [2]. If a customer says things like "talk to a supervisor" or repeats the same question three times, pattern matching can detect that, and the escalation risk score goes up [13].
That kind of full coverage makes it easier to spot low-confidence answers, script drift, and unresolved loops across every conversation.
Automate the next step based on feedback signals
Reading feedback only matters if it sets something in motion. The aim is to close the loop on its own: send the right issue to the right place without waiting on a manager to comb through a report.
Routine, high-confidence queries can be handled by AI directly. When sentiment drops or confidence falls below a set threshold, the conversation routes to a human agent. Converso can hand off high-risk conversations to a human agent with full context preserved, so nothing needs to be repeated.
Before rolling out any automated action at scale, run the model in shadow mode first. Let it make decisions without acting on them, then measure precision and recall against real outcomes [9]. It also helps to set a minimum threshold before automation starts. Requiring at least 3 to 5 reports of a specific failure category before triggering a prompt update keeps the system from reacting to noise [13].
The table below maps each technique to its ROI use case. Use these outputs to feed the ROI dashboard in Step 4.
| AI Technique | Input Data | Output | ROI Use Case |
|---|---|---|---|
| Sentiment Analysis | Chat transcripts | Tone and trajectory signal | Churn prevention by flagging high-risk interactions for immediate intervention [14][2] |
| Intent Classification | Customer queries and context | Intent labels (e.g., "Billing Issue", "Cancellation") | Automated routing to reduce labor costs and resolution time [14][10] |
| Topic Clustering | Aggregated feedback events | Recurring themes (e.g., "Onboarding Friction") | Prioritizing product fixes that address recurring bugs or feature requests [9][6] |
| Conversation Scoring | Agent/AI responses vs. rubrics | Quality score, confidence level, escalation risk flag | Reducing revenue loss by catching low-confidence or non-compliant answers [11][12] |
| Behavioral Signals | Message timing, repetition, abandonment | Failure event triggers (e.g., "Retry", "Escalation") | Identifying friction points that explicit feedback consistently misses [13] |
Conversation scores and escalation flags tie straight to cost, retention, and resolution speed, which are the three ROI levers this guide tracks throughout.
Step 4: Measure ROI and Refine the System Over Time
Build dashboards that connect feedback to dollars
Once AI starts scoring live feedback, the next step is simple: show that those signals changed cost, retention, or revenue. The signals from Step 3 only matter if they connect to money.
A clean way to set this up is with three dashboard tiers: activity, efficiency, and revenue impact [15]. That structure helps teams see what’s happening, what’s getting better, and what it means for the business. It also keeps the team from getting stuck on surface-level numbers.
That part matters more than many teams think. Replyant estimates that 72% of AI investments are still destroying value through waste when teams are not measuring the right things [5]. This is where the baselines from Step 1 do the heavy lifting. Without them, it’s hard to prove anything changed.
Use the dashboard to show the inputs behind this formula:
Total ROI = ((Direct Revenue + Cost Savings + Indirect Revenue + CLV Impact) − Total AI Investment) ÷ Total AI Investment × 100% [16]
Use this formula when reporting ROI.
| Metric | Baseline | Current Value | Change | Estimated Financial Impact |
|---|---|---|---|---|
| AI Deflection Rate | 10% | 28% | +18% | $54,000 (Saved labor costs) |
| Cost per Resolved Conversation | $18.50 | $11.20 | −39% | $7.30 saved per ticket |
| Escalation Rate | 15% | 9% | −6% | $12,000 (Reduced senior agent time) |
| Expansion Revenue | $2.1M | $2.4M | +14% | $300,000 (AI-identified opportunities) |
A table like this gives people something concrete. Instead of saying the model is “working,” you can point to lower ticket costs, fewer escalations, and more expansion revenue.
Roll out in phases and optimize as you go
Once the dashboard is live, use the first pilot to test the model before you scale it. Start small. One channel or one queue is enough, along with 5–7 core metrics. That gives you a controlled way to see what’s changing without muddying the picture.
Most conversational AI investments break even in about 3.4 months [3], so the first 90 days should focus on one thing: proving the model works.
As rollout expands, keep an eye on outcome decay. That’s when accuracy stays steady, but business results slip [17]. On paper, the model can still look fine while the business case starts to weaken.
One early warning sign is a high reviewer override rate. If human agents keep overruling AI classifications, that usually means your escalation rules or intent taxonomy need work [9][17]. Put plainly, the model may still be labeling things neatly, but not in a way the team can use.
Converso makes phased rollout easier because it supports multiple workspaces and inboxes. That means you can run AI-assisted workflows for one product line or customer segment while another group stays on a manual process. It gives you a direct comparison group, which makes it much easier to isolate impact. When one workflow proves itself, moving it to another team or inbox is pretty simple.
You should also track the actionability ratio - the percentage of AI-surfaced issue clusters that lead to a shipped fix or a documented action [9]. This number helps answer a blunt but useful question: Are we finding things people can actually do something about?
If that ratio is low, the problem often sits in one of two places:
- The taxonomy doesn’t match how the team works
- The confidence thresholds are surfacing too much low-value noise
Conclusion: The direct path from feedback to ROI
With this system in place, ROI gets much easier to see in real time. The logic behind the whole process is straightforward: feedback only creates ROI when it moves fast enough to change a decision.
Start by defining ROI goals. Then map each feedback signal to a business metric. Pull clean, time-stamped data into one place. Use AI to spot sentiment shifts, intent patterns, and escalation risk as they happen. After that, let dashboards turn those signals into dollars.
The key is to track activity, efficiency, and revenue impact - not volume alone. A lot of ROI disappears in the gap between collecting feedback and doing something with it. Closing that gap, with the right data flow, the right AI layer, and dashboards built around financial outcomes, is what turns support into a measurable growth lever.
From Hype to ROI: Measuring the real ROI of AI in Customer Support
FAQs
How do I choose the best ROI metrics to track first?
Start with ROI metrics that are simple to explain, easy to back up, and directly tied to business results. Put cost avoidance first.
That means focusing on metrics like:
- Support ticket deflection
- Human time freed
- Error reduction
These are often the easiest numbers to defend because they connect to saved labor, lower support load, and fewer mistakes.
Then layer in impact metrics, such as response time improvement, customer retention, and revenue per employee. It also helps to track numbers you can measure often and with confidence, including resolution rates, CSAT, and time to resolution.
What data do I need before using AI on feedback?
Before you use AI on feedback, start with a simple audit. Find out where your customer feedback lives, then pull those sources into one place. That usually includes support tickets, surveys, reviews, social media, and messaging channels.
Next, set your KPIs and thresholds. Then measure your current baseline for things like sentiment, urgency, response time, CSAT, churn, and resolution time. This gives AI clear inputs and a solid way to track improvement.
How long does it usually take to prove AI ROI?
Measurable ROI from AI investments often shows up within 30 to 60 days.
The bigger gains usually appear within 3 to 6 months, depending on how complex the solution is and how smoothly it fits into your existing setup.



.svg)
.svg)
.svg)
.svg)