
Real-Time Metrics for AI Agents
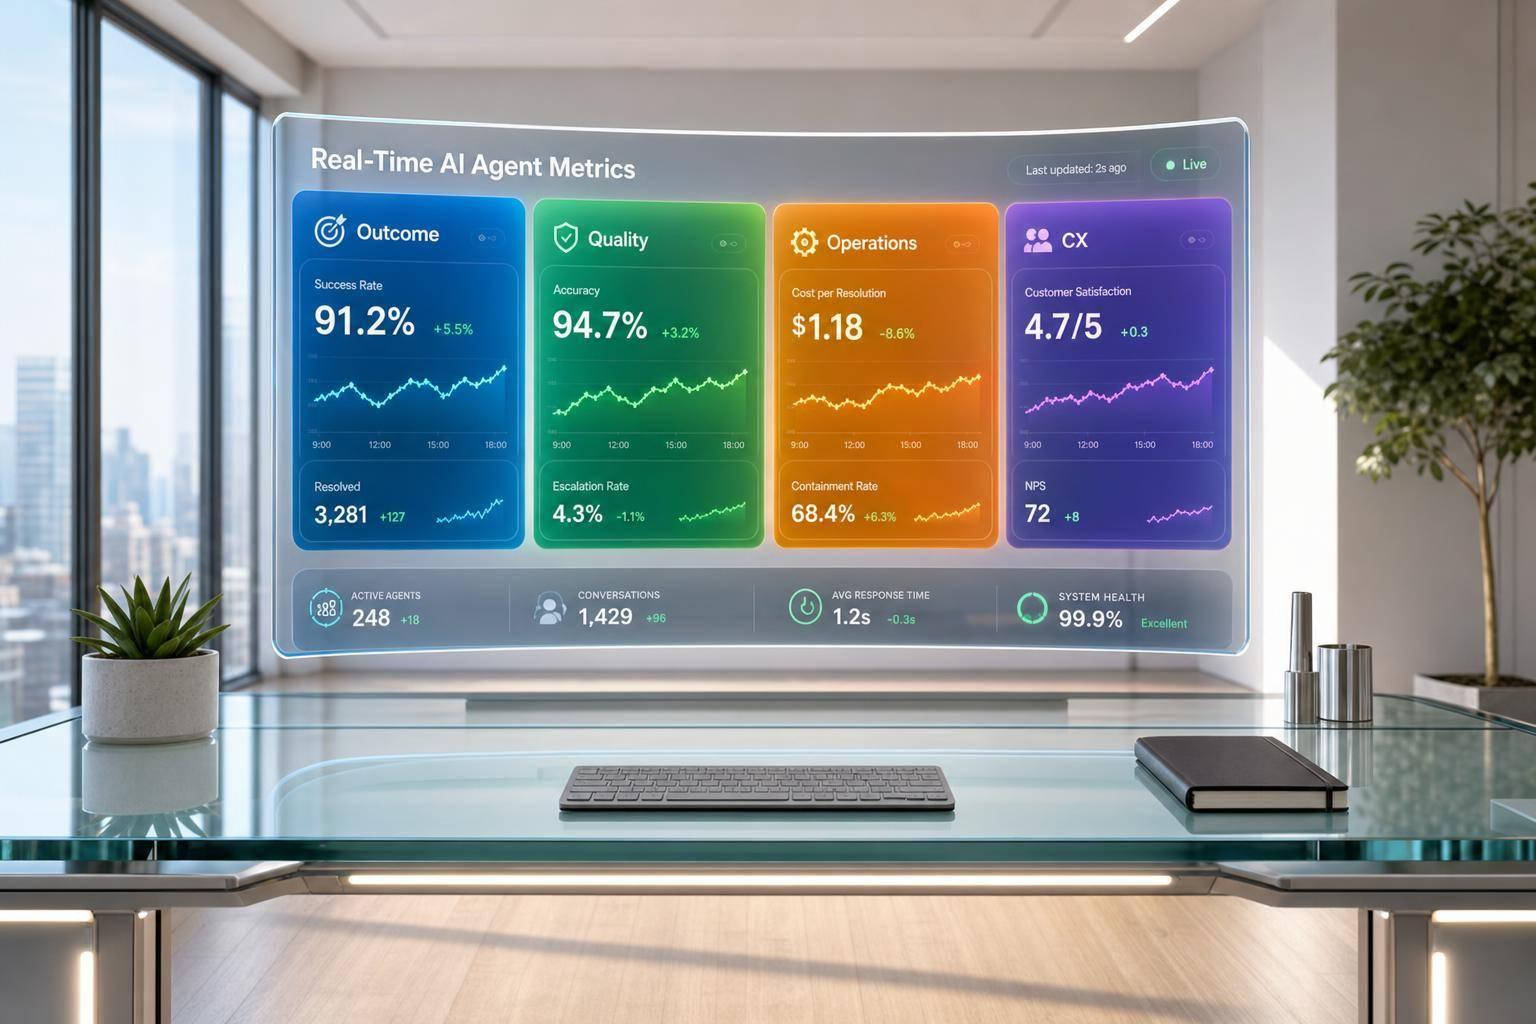
If I wait for weekly reports, I’m already late. The main point is simple: I need live metrics that show whether an AI support agent is solving the issue, giving a sound answer, and handing off to a human without losing context.
Here’s the short version:
- I track outcome metrics like resolution rate, containment, and first contact resolution
- I watch quality signals like accuracy, relevance, groundedness, and fallback rate
- I monitor system signals like response latency, session volume, token usage, and cost per conversation
- I keep an eye on customer signals like CSAT, customer effort, abandonment, and conversation length
- I measure escalation health with escalation rate, handoff wait time, and context preservation
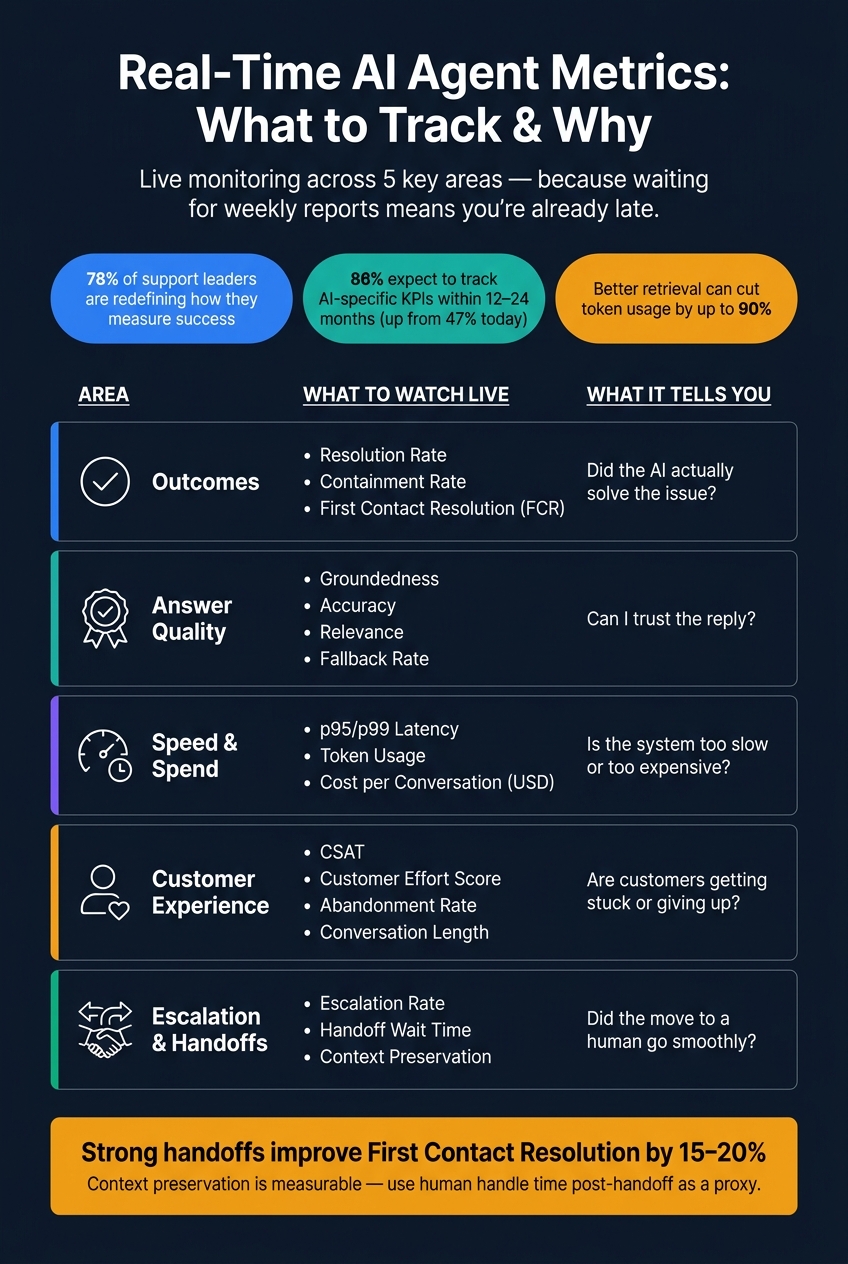
A few numbers make the case clear. The article notes that 78% of support leaders are changing how they measure success, and 86% expect to track AI-specific KPIs within 12 to 24 months, up from 47% today. It also points out that better retrieval can cut token use by up to 90%, and that strong handoffs can improve first contact resolution by 15% to 20%.
What matters most is not raw activity. It’s whether the AI is helping customers right now without driving up cost or leaving people stuck.
Quick view:
| Area | What I watch live | What it tells me |
|---|---|---|
| Outcomes | Resolution rate, containment, FCR | Did the AI solve the issue? |
| Answer quality | Groundedness, accuracy, fallback rate | Can I trust the reply? |
| Speed & spend | p95/p99 latency, token use, cost per conversation | Is the system too slow or too expensive? |
| Customer experience | CSAT, effort, abandonment, chat length | Are customers getting stuck or giving up? |
| Handoffs | Escalation rate, transfer wait time, context kept | Did the move to a human go well? |
In other words: live AI monitoring is about outcomes, risk, customer experience, and spend - not just volume and reply counts.
Real-Time AI Agent Metrics: What to Track & Why
Deep Dive: How to Monitor AI Agents in Production
sbb-itb-e1b05dc
The Core Real-Time Metrics to Track
Once your basic monitoring is set up, the next step is simple: watch the metrics that tell you if the agent is solving problems, thinking clearly, and replying well. For a live dashboard, those metrics usually fall into three buckets: outcome, quality, and operational.
Outcome Metrics: Resolution Rate, Containment Rate, and First Contact Resolution
Resolution rate is the share of conversations the AI solves without handing the case to a human. In live support, this is the main signal to keep an eye on. Containment rate and FCR help round out the picture, but resolution rate is the one tied most directly to the support call you have to make. If it slips, check scope, knowledge freshness, and escalation rules.
When resolution rate drops all of a sudden, the cause is often pretty plain: a knowledge gap, a policy shift, or a product update the agent hasn’t picked up yet.
Quality Metrics: Accuracy, Relevance, Groundedness, and Fallback Rate
Outcome tells you if the conversation ended well. Quality tells you if the answer was safe to trust.
Groundedness is the main quality metric here. It shows whether the agent’s response is backed by your knowledge base or whether it’s making a guess. For live detection, use confidence tagging on agent outputs. Responses pulled straight from source content are traceable and auditable. Inferred responses bring more risk, especially for pricing, compliance, or troubleshooting steps.
Fallback rate measures how often the agent gives a non-answer or routes the user to a default message. That’s often an early sign of scope or knowledge gaps, even before full escalation starts. If fallback rate climbs while groundedness stays low, that’s your cue to audit the knowledge base while the customer is still waiting.
Operational Metrics: Response Latency, Session Volume, Token Usage, and Cost per Conversation
Once accuracy is in a good place, look at how efficiently the system is doing the work. Operational metrics show what each response costs you in time and money.
Track response latency at p50, p95, and p99 so you can see the full spread of session performance. Efficient retrieval can cut token use by up to 90% [3]. Across thousands of daily sessions, that adds up fast. If token usage jumps but resolution rate doesn’t move, your retrieval layer or prompt chain is probably pulling in extra context that the model doesn’t need. That slows replies and pushes costs up.
Cost per conversation (in USD) connects latency and token usage to budget impact. In practice, it’s the metric that links live performance to operating spend.
| Metric | What It Measures | Alert Condition |
|---|---|---|
| Resolution Rate | Sessions resolved without human handoff | Drop below your established baseline |
| Fallback Rate | Non-answers or default responses | Rising rate signals scope or knowledge gaps |
| Groundedness | Responses backed by source vs. guessed | High inference rate - audit knowledge base |
| p95 Latency | Response time for 95% of sessions | Spikes indicate retrieval or model load issues [3] |
| Cost per Conversation | USD cost per automated session | Token spikes without resolution gains = inefficiency [3] |
Customer Experience and Escalation Signals
Outcome and quality metrics tell you whether the agent did the job. CX metrics tell you whether the customer actually felt that difference. And there’s another layer that matters just as much: what the customer is feeling while the conversation is still happening.
CSAT, Effort, Abandonment, and Conversation Length
Customer Effort Score (CES) measures how hard a customer had to work to get an answer - and it's highly predictive of loyalty and churn [2], no matter how fast the reply showed up.
Abandonment signals are where a lot of teams slip. A session can end without a handoff and still be a bad experience if the customer simply gave up and left.
Track conversation length alongside abandonment. If sessions run long and still don’t get resolved, that points to friction, not interest. It’s a bit like being stuck in a checkout line that never moves - time passes, but nothing gets done. Pair this with real-time sentiment signals, because post-chat surveys miss most interactions.
If those signals start to drift in the wrong direction, the next thing to check is simple: should the agent be escalating sooner?
Escalation Rate, Handoff Latency, and Context Preservation
Escalation only means something if the handoff can be measured. Escalation rate shows how often the AI can’t resolve the issue on its own. That isn’t bad by itself. In many cases, escalation is the right move - as long as it happens early enough and the human gets the right context.
Track handoff latency through unreplied transferred messages [1]. These customers have already spent time with the AI, so they’re more likely to feel annoyed if the human reply takes too long.
Context preservation can be measured too. One useful proxy is human handle time after handoff. If human agents can wrap up transferred chats fast, they likely got enough context - chat history, user data, and summaries - to keep things moving without making the customer repeat everything [4]. If that handle time jumps after handoffs, context is being lost during the transfer. Teams that do this well can see a 15–20% improvement in First Contact Resolution [4].
How Converso Supports Live AI-to-Human Handoffs
This is where live handoff orchestration starts to matter. Converso handles live AI-to-human handoffs across web chat and WhatsApp while keeping conversation history, customer metadata, and AI reasoning context available for the human agent. If a session moves across channels, it keeps one conversation ID, so the experience stays continuous [1]. Unreplied messages, including transferred chats still waiting for a human reply, appear in real time in the shared inbox [1].
How to Build Dashboards, Alerts, and Governance Around These Metrics
Designing a Live Dashboard for Support Leaders
Knowing which metrics matter is only half the job. The other half is making them visible in a way that leads to action - without burying your team in numbers.
A live dashboard should group metrics into five panels:
- Outcomes: resolution rate, containment rate
- Quality: accuracy, relevance, groundedness, fallback rate
- Latency: p99 response time, handoff latency
- Experience: CSAT, effort, abandonment
- Cost: cost per conversation
That setup helps turn raw numbers into clear next steps. You move from “what happened?” to “what needs attention right now?”
The dashboard also needs to match the person using it. Individual agents need a tight, practical view: their assigned conversations and unreplied messages. Support leaders need the workspace view instead: unassigned conversations, total unreplied messages, and anomaly detection signals. Unreplied messages should come first. They need action now. Unread messages don't always.
Setting Thresholds and Real-Time Alerts
Not every metric needs a real-time alert. Some issues need an instant signal. Others are better handled in a weekly review.
Immediate alerts fit operational failures. That includes a spike in p99 latency, a fallback rate moving above baseline, or a containment rate dropping fast in a short window. Anomaly detection can help flag sudden jumps in latency, fallback rate, or conversation volume. This is where speed matters. If customers are already feeling the problem, the team needs to know fast.
Weekly reviews make more sense for longer-term patterns like cost per resolution over time, CSAT movement, or AI vs. human performance by topic. The point is simple: step in early, not after the damage is done.
Metric Priorities and Tradeoffs: A Comparison
Every metric comes with a tradeoff. Push containment rate too hard, for example, and customers can get stuck in loops the AI can't solve. On paper, efficiency may look strong. In practice, CSAT can take a hit.
Once the dashboard is live, that's the next hard question: which metric should win when signals clash?
| Metric | What It Improves | Risks Created | When to Prioritize |
|---|---|---|---|
| Containment Rate | Operational capacity; reduces human agent workload | Can hide customer frustration if the AI traps users without resolving issues | High-volume, low-complexity queries |
| Latency (p99) | Real-time experience; reduces abandonment | Speed gains may lower accuracy or increase token costs | Messaging channels where delays cause drop-off |
| Customer Satisfaction (CSAT) | Long-term loyalty and brand trust | High CSAT can be expensive if it requires frequent human intervention | Complex issues or high-value customer segments |
The right balance depends on the team and the use case. A team scaling on high-volume, repetitive queries should put more weight on containment. A team working with enterprise accounts and messy onboarding flows should care more about CSAT and context preservation.
AI changes what success looks like. Teams have to balance automation efficiency with customer outcomes.
Governance means making those tradeoffs on purpose.
Conclusion: Turning Real-Time Metrics Into Better Support Outcomes
Once your dashboards and alerts are up, the last piece is simple: act on what the numbers are telling you.
Real-time metrics only matter if they lead to a decision. If containment rate drops, that usually points to a knowledge gap. If escalation rate jumps, your team may need retraining. If customer effort starts climbing, friction is building before CSAT takes a hit.
Support teams are already shifting how they measure performance. 78% of leaders are redefining success, and 86% expect to track AI-specific KPIs within 12 to 24 months, up from 47% today [2]. That's a fast change in how teams judge what good support looks like.
Use each signal to decide what happens next:
- Retrain the system or team
- Escalate when the issue needs human help
- Re-scope the knowledge base when coverage is off
That same approach should extend into your support platform. Converso brings together automation, scoped knowledge, and in-context handoff, so live signals turn into direct action. The aim is better support: faster, smarter, and more consistent.
FAQs
How do I set a baseline for AI support metrics?
Track current performance for key metrics like First Response Time, resolution time, Customer Satisfaction Score, agent productivity, and cost per ticket over 30 to 90 days before you roll out your AI agent.
To make that baseline useful, break the data down by support channel, customer type, and issue category. That way, you can compare post-deployment results against your pre-AI benchmarks and measure ROI with a lot more confidence.
Which metrics should I alert on in real time?
Set alerts on metrics that show, right away, how your AI is performing and what customers are dealing with. Pay close attention to:
- Unreplied messages
- Escalation rates
- Real-time sentiment analysis
- Anomaly detection for ticket volume or sudden topic spikes
These signals help you see when a human needs to step in, flag low AI confidence, catch frustration early, and act before service issues spread to more customers.
How can I tell if handoffs are hurting resolution?
Track the metrics tied to handed-off interactions.
A few warning signs tend to show up fast:
- A high repeat question rate
- Lower CSAT on handed-off conversations
- High post-handoff AHT
When those numbers slip, it can point to missing context or weak routing.
It also helps to watch how often agents need to ask for details the AI should’ve already collected. If escalation rates are high, that’s another sign the handoff flow may be breaking down.
As a simple benchmark, aim for repeat questions below 5.0% and CSAT above 85.0%.


.svg)
.svg)
.svg)
.svg)